
搜索到
18
篇与
的结果
-
 openEuler 搭建本地 repo 源 1 前言everything 镜像中包含了许多 rpm 包,可以提供基本的安装使用,然而还有一部分软件包需要连网到公网 repo 源中下载。但是在生产环境中,服务器大多数是不能连接公网的,因此需要搭建一个局域网 repo 源,即让一台能够连接公网的服务器从公网 repo 源中同步 rpm 包到本地,然后局域网的其他服务器再从这台能连接公网的服务器中下载 rpm 包2 所需的服务或命令2.1 Web 服务用于局域网中其他服务器访问,可以使用 httpd 服务或 nginx 服务2.2 dnf reposync 命令$ dnf reposync [OPTIONS] -c [CONFIG FILE] 指定配置文件运行(默认配置文件是 /etc/yum.conf) -q 安静操作 -v 显示详细信息 -b 尝试使用最佳的软件包版本 -C 完全从系统缓存运行,不更新缓存 -R [minutes] 最大命令等待时间 -y 所有问题自动回答 yes --assumeno 所有问题自动回答 no --enablerepo [repo] 启用其他存储库,可以指定多次 --disablerepo [repo] 禁用仓库,可以指定多次 --repo [repo], --repoid [repo] 仅使用指定的存储库 --exclude [package] 排除软件包 --forcearch ARCH 强制使用指定的架构 --arch [arch] 仅下载指定架构的软件包 --delete 删除存储库中不再存在的本地软件包 -n 仅下载最新的软件包 -p DOWNLOAD_PATH 指定软件包下载的位置 --norepopath 在下载目录中不重新生成以 `repo name` 命名的目录2.3 createrepo 命令$ createrepo [OPTION?] <directory_to_index> -q 以安静模式运行 -v 显示详细信息 -o 指定生成的元数据存放的位置 --excludes=PACKAGE_NAME_GLOB 指定生成元数据时排除的包 --update 在原有元数据上升级,只更新有变化的软件 --workers 读取 rpm 包的数量,默认为 53 同步官方源服务器名称用途操作系统版本IP 地址Server搭建局域网 repo 源openEuler 22.03 LTS SP1192.168.255.221Client模拟局域网内主机openEuler 22.03 LTS192.168.255.2203.1 Server 端配置3.1.1 系统基本设置# 关闭防火墙,并停止开机自启 $ systemctl stop firewalld $ systemctl disable firewalld # 关闭 SELinux $ setenforce 0 # 安装用于提供 reposync 命令的工具包 $ yum install -y dnf-plugins-core # 安装用于提供 createrepo 命令的工具包 $ yum install -y createrepo # 创建专用目录,保存同步的 RPM 包 $ mkdir /openEuler-22.03-LTS-REPO另外注意要留有足够的分区空间去保存 RPM 包3.1.2 配置 Web 服务此处使用 nginx 服务# 安装 nginx $ yum install -y nginx # 启动服务,并设置开机自启 $ systemctl start nginx $ systemctl enable nginx # 在默认网页根目录下创建 openEuler-22.03-LTS 目录及以下子目录,用来存放 RPM 包 $ mkdir -p /usr/share/nginx/html/openEuler-22.03-LTS/{everything,update,EPOL} $ mkdir -p /usr/share/nginx/html/openEuler-22.03-LTS/EPOL/main # 编写配置文件,允许显示目录索引 $ cat > /etc/nginx/conf.d/openEuler-22.03-LTS.conf <<EOF server { listen 8001; root /usr/share/nginx/html/openEuler-22.03-LTS; location / { autoindex on; autoindex_exact_size off; autoindex_format html; autoindex_localtime on; } } EOF # 重启 nginx 服务 $ systemctl restart nginx使用 Windows 浏览器访问 http://192.168.255.221:8001,查看访问是否正常3.1.3 配置 repo 源Server 端需要配置局域网内客户端主机操作系统的 repo 源。例如本实验中作为局域网 repo 源服务器的 Server 端的操作系统版本为 openEuler 22.03 LTS SP1,而客户端主机操作系统为 openEuler 22.03 LTS,那么需要在 Server 端配置 openEuler 22.03 LTS 操作系统的 repo 源openEuler 各版本的 repo 源可以在论坛中找到:【汇总贴】openEuler常用repo源 - 迁移 - openEuler 论坛注意:一定要修改新添加的 repo 源的 repo id 和 repo name,即修改 [ REPO ID ] 和 naem=REPO NAME 的内容,否则可能会和现有的 repo 源名字冲突# 在 Server 端配置客户端主机操作系统的 reop 源 $ cat > /etc/yum.repos.d/openEuler-22.03-LTS.repo <<EOF [openEuler-22.03-everything] name=openEuler-22.03-everything baseurl=http://repo.huaweicloud.com/openeuler/openEuler-22.03-LTS/everything/x86_64/ enabled=1 gpgcheck=0 gpgkey=http://repo.huaweicloud.com/openeuler/openEuler-22.03-LTS/everything/x86_64/RPM-GPG-KEY-openEuler [openEuler-22.03-EPOL] name=openEuler-22.03-EPOL baseurl=http://repo.huaweicloud.com/openeuler/openEuler-22.03-LTS/EPOL/main/x86_64/ enabled=1 gpgcheck=0 [openEuler-22.03-update] name=openEuler-22.03-update baseurl=http://repo.huaweicloud.com/openeuler/openEuler-22.03-LTS/update/x86_64/ enabled=1 gpgcheck=0 EOF # 清空 yum 缓存 $ yum clean all # 重建 yum 缓存 $ yum makecache # 查看当前的 repo 源 $ yum repolist repo id repo name openEuler-22.03-EPOL openEuler-22.03-EPOL openEuler-22.03-everything openEuler-22.03-everything openEuler-22.03-update openEuler-22.03-update从命令返回结果看到,openEuler 22.03 LTS 版本的 repo 源已经成功添加,另外需要记住此处的 repo id ,在同步时会指定 --repoid=REPO_ID 选项3.1.4 同步 everything 源(1)同步 everything 源的 RPM 包到本地# 同步 everything 源的 RPM 包到本地 $ dnf reposync -v --repoid=openEuler-22.03-everything -p /openEuler-22.03-LTS-REPO # 同步完成后会在 /openEuler-22.03-LTS-REPO 目录创建一个名称同 repo name 的目录 $ ls /openEuler-22.03-LTS-REPO/ openEuler-22.03-everything # 查看目录结构 $ tree -L 1 /openEuler-22.03-LTS-REPO/openEuler-22.03-everything/ /openEuler-22.03-LTS-REPO/openEuler-22.03-everything/ └── Packages(2)生成 everything 源的 RPM 包元数据# 执行以下命令生成元数据 $ createrepo -v --workers 10 /openEuler-22.03-LTS-REPO/openEuler-22.03-everything # 查看生成元数据后的目录结构 $ tree -L 1 /openEuler-22.03-LTS-REPO/openEuler-22.03-everything/ /openEuler-22.03-LTS-REPO/openEuler-22.03-everything/ ├── Packages └── repodata # 查看生成的元数据文件 $ ls /openEuler-22.03-LTS-REPO/openEuler-22.03-everything/repodata 0079e1d3bd752a19486cb91269c98c8b5a6254d3ca13e5c0326e085561f1ed2a-other.sqlite.bz2 355628d38b0cd6163757264bc7971f3d86ff1d530a44c034786f3116b167f490-filelists.xml.gz 73565b368f50f6d2bb92543e2f7bcef4a9bc159ccdfbc728fc22e9b2ed5bb528-primary.xml.gz 7c20d73494e2525944a113b55983be13ba437e354da3e45f19f456b8f39457b4-other.xml.gz 9b353c421ef03be739e96d529e92393dfc4864205d974309a6af813e47893fff-filelists.sqlite.bz2 bd6c1976aae37a44ef7c7f9390c0321b4f7a27c4991e318f57b9c37016cb32fa-primary.sqlite.bz2 repomd.xml(3)创建软链接到 nginx 网页根目录# 创建 everything 源软链接到 nginx 网页根目录 $ ln -s /openEuler-22.03-LTS-REPO/openEuler-22.03-everything/ /usr/share/nginx/html/openEuler-22.03-LTS/everything/x86_643.1.5 同步 update 源(1)同步 update 源的 RPM 包到本地# 同步 update 源的 RPM 包到本地 $ dnf reposync -v --repoid=openEuler-22.03-update -p /openEuler-22.03-LTS-REPO # 同步完成后会在 /openEuler-22.03-LTS-REPO 目录创建一个名称同 repo name 的目录 $ ls /openEuler-22.03-LTS-REPO/ openEuler-22.03-update # 查看目录结构 $ tree -L 1 /openEuler-22.03-LTS-REPO/openEuler-22.03-update/ /openEuler-22.03-LTS-REPO/openEuler-22.03-update/ └── Packages(2)生成 update 源的 RPM 包元数据# 执行以下命令生成元数据 $ createrepo -v --workers 10 /openEuler-22.03-LTS-REPO/openEuler-22.03-update # 查看生成元数据后的目录结构 $ tree -L 1 /openEuler-22.03-LTS-REPO/openEuler-22.03-update /openEuler-22.03-LTS-REPO/openEuler-22.03-update ├── Packages └── repodata # 查看生成的元数据文件 $ ls /openEuler-22.03-LTS-REPO/openEuler-22.03-update/repodata 8943580f5aefe7f532fbbd9f19d771aaf9407a855b0acad33723007d8dde4199-primary.xml.gz ad1a113f7358bfebf9d13783d8fa8ce0a9b151725ecfc2da059226280422c30a-other.xml.gz bf573c34d9f77a76757a2a496b2c9ee671dddc81d660a95b063f8b81b8d7a4f9-filelists.sqlite.bz2 c6b747c4c6ee6cb6a44683b4a3636066cba5c9e573ea19ad95a5e315a9af1836-primary.sqlite.bz2 e152e3b11a7fcf011e16a27f7e6ba855ac12025b114ec5916e09d4edb0fa61e9-other.sqlite.bz2 f88eb68a9e41086c6b2de992367613c9b1e530bea82a73aa82e6faad6e5ed53d-filelists.xml.gz repomd.xml(3)创建软链接到 nginx 网页根目录# 创建 update 源软链接到 nginx 网页根目录 $ ln -s /openEuler-22.03-LTS-REPO/openEuler-22.03-update/ /usr/share/nginx/html/openEuler-22.03-LTS/update/x86_643.1.6 同步 EPOL 源(1)同步 EPOL 源的 RPM 包到本地# 同步 update 源的 RPM 包到本地 $ dnf reposync -v --repoid=openEuler-22.03-EPOL -p /openEuler-22.03-LTS-REPO # 同步完成后会在 /openEuler-22.03-LTS-REPO 目录创建一个名称同 repo name 的目录 $ ls /openEuler-22.03-LTS-REPO/ openEuler-22.03-EPOL # 查看目录结构 $ tree -L 1 /openEuler-22.03-LTS-REPO/openEuler-22.03-EPOL /openEuler-22.03-LTS-REPO/openEuler-22.03-EPOL/ └── Packages(2)生成 EPOL 源的 RPM 包元数据# 执行以下命令生成元数据 $ createrepo -v --workers 10 /openEuler-22.03-LTS-REPO/openEuler-22.03-EPOL # 查看生成元数据后的目录结构 $ tree -L 1 /openEuler-22.03-LTS-REPO/openEuler-22.03-EPOL /openEuler-22.03-LTS-REPO/openEuler-22.03-EPOL ├── Packages └── repodata # 查看生成的元数据文件 $ ls /openEuler-22.03-LTS-REPO/openEuler-22.03-EPOL/repodata 2d41ed62331b529104c7b04fd34680e8eeb8783e212e910e5230daaa66a900a4-filelists.sqlite.bz2 3445b86e5fd0157d0fd08aaf06cde6f1feca76517b574d8fdd3b40abe827b71e-other.xml.gz 709755e7d41e355645979f47b78155234bae9d50b2422105a4b03fca6ea93c83-filelists.xml.gz 70e673639de7efb802e65a54ce80e99c49ea93b1a8a4b4a676a47a91cadc99fa-primary.xml.gz 8c1cb6add3f18391a70436bed3bca18b9e0eac6861d8c5e2266c9952be3ea9f0-other.sqlite.bz2 bae172c52a64e4637d189780ff27d983e3c97bcbc17278f74afe0a23ab6e9ecd-primary.sqlite.bz2 repomd.xml(3)创建软链接到 nginx 网页根目录# 创建 EPOL 源软链接到 nginx 网页根目录 $ ln -s /openEuler-22.03-LTS-REPO/openEuler-22.03-EPOL/ /usr/share/nginx/html/openEuler-22.03-LTS/EPOL/main/x86_643.1.7 在前端界面查看 RPM 包使用 Windows 浏览器访问: http://192.168.255.221:8001,查看 RPM 包3.2 Client 端配置3.2.1 系统基本设置# 关闭防火墙,并停止开机自启 $ systemctl stop firewalld $ systemctl disable firewalld # 关闭 SELinux $ setenforce 03.2.2 配置 repo 源# 创建备份目录,将现有的 repo 源都移动到备份目录中 $ cd /etc/yum.repos.d/ $ mkdir bak $ mv ./* bak/ # 编写新的 repo 源,URL 地址指向局域网 repo 源服务器 cat > /etc/yum.repos.d/lan.repo <<EOF [openEuler-22.03-everything] name=openEuler-22.03-everything baseurl=http://192.168.255.221:8001/everything/x86_64/ enabled=1 gpgcheck=0 [openEuler-22.03-EPOL] name=openEuler-22.03-epol baseurl=http://192.168.255.221:8001/EPOL/main/x86_64/ enabled=1 gpgcheck=0 [openEuler-22.03-update] name=openEuler-22.03-update baseurl=http://192.168.255.221:8001/update/x86_64/ enabled=1 gpgcheck=0 EOF # 清空 yum 缓存 $ yum clean all # 重建 yum 缓存 $ yum makecache # 查看当前的 repo 源 $ yum repolist repo id repo name openEuler-22.03-EPOL openEuler-22.03-epol openEuler-22.03-everything openEuler-22.03-everything openEuler-22.03-update openEuler-22.03-update3.2.3 测试 repo 源# 随便搜索一个软件包 $ yum provides tree Last metadata expiration check: 0:08:11 ago on Wed 13 Dec 2023 04:36:36 PM CST. tree-1.8.0-2.oe2203.x86_64 : Tree file viewer tool Repo : openEuler-22.03-everything Matched from: Provide : tree = 1.8.0-2.oe2203 # 安装搜索的软件包 $ yum install -y tree4 使用 .iso 镜像搭建本地 repo 源4.1 基于 HTTP 协议搭建# 安装 httpd 服务及其他工具 $ yum install -y httpd createrepo # 修改配置文件,不显示默认网页 $ mv /etc/httpd/conf.d/welcome.conf /etc/httpd/conf.d/welcome.conf.bak $ sed -i '/^\s*DirectoryIndex/ s/index.html//' /etc/httpd/conf/httpd.conf # 挂载 everything 镜像 $ mount /dev/sr0 /mnt/ # 创建 repo 目录 $ mkdir -p /var/www/html/openEuler-LTS-SP1/Package # 从镜像中复制软件包到 repo 目录 $ cp /mnt/Packages/* /var/www/html/openEuler-LTS-SP1/Package/ # 生成元数据信息 $ createrepo -v --workers 20 /var/www/html/openEuler-LTS-SP1/ # 修改目录及文件权限 $ chmod 755 /var/www/html/openEuler-LTS-SP1/Package/ $ chmod 755 /var/www/html/openEuler-LTS-SP1/repodata/ $ chmod 644 /var/www/html/openEuler-LTS-SP1/Package/* $ chmod 644 /var/www/html/openEuler-LTS-SP1/repodata/* # 启动 httpd 服务 $ systemctl start httpd客户端编写 repo 文件:# 编写 repo 文件 $ cat > /etc/yum.repos.d/local.repo <<EOF [local-repo] name=local-repo baseurl=http://192.168.230.201/openEuler-LTS-SP1/ enabled=1 gpgcheck=0 EOF4.2 基于 FTP 协议搭建# 安装 vsftpd 服务及其他工具 $ yum install -y vsftpd createrepo # 配置 vsftpd 服务,允许匿名用户登录 $ sed -i '/^anonymous_enable/c anonymous_enable=YES' /etc/vsftpd/vsftpd.conf # 挂载 everything 镜像 $ mount /dev/sr0 /mnt/ # 创建 repo 目录 $ mkdir -p /var/ftp/pub/openEuler-22.03-LTS-SP1/Packages # 从镜像中复制软件包到 repo 目录 $ cp /mnt/Packages/* /var/ftp/pub/openEuler-22.03-LTS-SP1/Packages/ # 生成元数据信息 $ createrepo -v --workers 20 /var/ftp/pub/openEuler-22.03-LTS-SP1/ # 启动 vsftpd 服务 $ systemctl start vsftpd客户端编写 repo 文件:# 编写 repo 文件 $ cat > /etc/yum.repos.d/local.repo <<EOF [local-repo] name=local-repo baseurl=ftp://192.168.230.201/pub/openEuler-22.03-LTS-SP1/ enabled=1 gpgcheck=0 EOF
 -
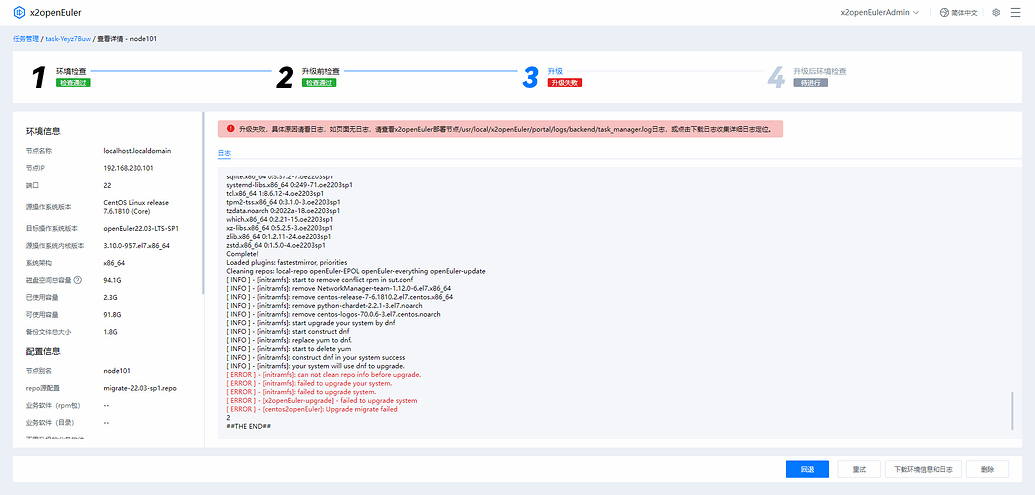
使用 x2openEuler 升级过程遇到 can not clean repo info before upgrade 报错的解决方案 1 问题背景近期又遇到多起在升级过程中报错,报错信息为 “can not clean repo info before upgrade”,如下图所示:这是因为在待升级节点执行 dnf clean all 命令时报错此时很多朋友会有疑问:我的操作系统没有装 dnf ,我的操作系统上不能装 dnf ,等等,那么为什么要去执行 dnf clean all 命令呢?这要从工具升级的原理说起,在报错信息的上面几行有这样的信息:...... [ INFO ] - [initramfs]: start upgrade your system by dnf [ INFO ] - [initramfs]: start construct dnf [ INFO ] - [initramfs]: replace yum to dnf. [ INFO ] - [initramfs]: start to delete yum [ INFO ] - [initramfs]: construct dnf in your system success [ INFO ] - [initramfs]: your system will use dnf to upgrade. ......明显可以看到,工具做了一系列操作:开始构建 dnf使用 dnf 去替换 yum开始删除 yum成功在你的操作系统上构建 dnf你的系统将使用 dnf 去升级dnf 是 yum 的下一代版本,dnf 比 yum更快速和高效,并且 dnf 在解决软件包依赖关系方面比 yum 更强大和智能,能够更好地处理复杂的依赖关系,这也是为什么工具或者以后的操作系统都是用 dnf 作为包管理工具的原因既然知道了症结所在,那么就可以对症下药了!2 规避方案2.1 执行 dnf clean all 命令查看报错在待升级节点手动执行 dnf clean all 命令查看具体报错:报错显示是和 openssl 的库文件有关,具体信息为:“这个错误表明你的系统中的 libldap 库试图使用 EVP_md2 这个加密库函数,但是这个函数在当前系统中的 OpenSSL 版本中不存在或未定义。 EVP_md2 是一个散列函数,用于计算 MD2 散列值,但在较新版本的OpenSSL 中,可能已经将 MD2 作为过时的算法移除了。”2.2 查看 openssl 版本首先执行 rpm -qa | grep openssl 命令查看系统安装的 openssl 版本:系统安装的 openssl 版本为 1.0.2k其次执行 openssl version -a 查看系统当前在用的 openssl 版本:系统在用的 openssl 版本为 1.1.1w系统安装的 openssl 版本和在用的版本不同,那么高版本的 openssl 必然是编译安装的,在编译安装 openssl 时,又必须需要指定高版本 openssl 库文件的位置,否则不能正常使用2.3 查看指定库的位置在 Centos 操作系统中,共有三种指定库文件位置的方式:将库文件所在目录添加到 /etc/ld.so.conf 文件中将库文件所在目录添加到指定文件,并将此文件放在 /etc/ld.so.conf.d/ 目录中将库文件所在目录添加到 LD_LIBRARY_PATH 环境便变量中(1)针对前两种指定库文件的方式,可以使用以下方法排查:① 确定编译安装的 openssl 库文件所在的目录:② 查找该目录具体写到哪个地方了:③ 从查找到的文件中注释掉该目录,之后执行 ldconfig 刷新动态链接库④ 执行 dnf clean all 命令,若无报错则可以到前端点击“重试”按钮继续升级(2)针对最后一种指定库文件的方式,可以使用以下方法排查:① 确定编译安装的 openssl 库文件所在的目录:② 查看 LD_LIBRARY_PATH 变量是否有定义此目录③ 若有则从该变量中剔除该目录④ 执行 dnf clean all 命令,若无报错则可以到前端点击“重试”按钮继续升级
-
openEuler 操作系统用户权限管理——sudo 权限的授予与限制案例 说明:本文旨在分享记录在 openEuler 操作系统中,如何对普通用户进行权限授予与限制所有操作演示基于 openEuler 22.03 LTS SP1 版本汇总多种权限授予与限制的案例1 sudo 权限本节内容摘自官方文档:管理用户和用户组 (openeuler.org)使用 sudo 命令可以允许普通用户执行管理员帐户才能执行的命令sudo 命令允许已经在 /etc/sudoers 文件中指定的用户运行管理员帐户命令。例如,一个已经获得许可的普通用户可以运行如下命令:sudo /usr/sbin/useradd newuserl/etc/sudoers 的配置行如下所示:空行或注释行(以 # 字符打头):无具体功能的行可选的主机别名行:用来创建主机列表的简称。必须以 Host_Alias 关键词开头,列表中的主机必须用逗号(,)隔开,如:Host_Alias FILESERVERS = fs1, fs2可选的用户别名行:用来创建用户列表的简称。用户别名行必须以 User_Alias 关键词开头,列表中的用户名必须以逗号(,)隔开。其格式同主机别名行:User_Alias ADMINS = jsmith, mikem可选的命令别名行:用来创建命令列表的简称。必须以 Cmnd_Alias 开头,列表中的命令必须用逗号(,)隔开:Cmnd_Alias PROCESSES = /bin/nice, /bin/kill, /usr/bin/kill, /usr/bin/killall可选的运行方式别名行:用来创建用户列表的简称。不同的是,使用这样的别名可以告诉 sudo 程序以列表中某一用户的身份来运行程序必要的用户访问说明行:user host=[ run as user ] command list以上字段的含义及说明如下表所示:字段含义说明user要授予 sudo 权限的用户指定一个真正的用户名或定义过的别名host该用户可以在哪个主机上执行命令指定一个真正的主机名或者定义过的主机别名run as user该用户以什么身份执行命令默认情况下,sudo 执行的所有命令都是以 root 身份执行command list该用户可以执行哪些命令可以是以逗号(,)分隔的命令列表,也可以是一个已经定义过的别名说明:可以在一行定义多个别名,中间用冒号 (:) 隔开可在命令或命令别名之前加上感叹号 (!),使该命令或命令别名无效有两个关键词:ALL 和NOPASSWD。ALL 意味着“所有”(所有文件、所有主机或所有命令),NOPASSWD 意味着不用密码通过修改用户访问,将普通用户的访问权限修改为同 root 一样,则可以给普通用户分配特权对于 /etc/sudoers 文件的修改,推荐使用 visudo 命令,能够在保存时检查语法是否有误/etc/sudoers 文件预先添加了一个用户(root)和一个用户组(wheel):## Allow root to run any commands anywhere root ALL=(ALL) ALL ## Allows people in group wheel to run all commands %wheel ALL=(ALL) ALL基于以上知识,可以实现对普通用户各种各样的授权与限制2 案例汇总2.1 案例一目标:授予普通用户创建用户,并修改用户密码的权限,但是禁止该用户修改 root 用户密码在 /etc/sudoers 文件中添加以下内容:user1 ALL=(ALL) /usr/sbin/useradd, /usr/bin/passwd, !/usr/bin/passwd "", !/usr/bin/passwd root配置说明:/usr/bin/useradd :允许 user1 用户执行 useradd USER 命令创建普通用户/usr/bin/passwd :允许 user1 用户执行 passwd USER 命令修改用户密码!/usr/bin/passwd root :禁止 user1 用户执行 passwd root 命令修改 root 用户密码!/usr/bin/passwd "" :禁止 user1 用户执行 passwd 命令修改 root 用户密码,因为 passwd 命令后边为空则默认为 root 用户效果演示:2.2 案例二目标:授予普通用户执行任何命令的权限方法一:可以将普通用户加入 wheel 组$ usermod -a -G wheel user1 $ id user1 uid=1000(user1) gid=1000(user1) groups=1000(user1),10(wheel)方法二:在 /etc/sudoers 文件添加以下内容user1 ALL=(ALL) ALL这两种方法的授权结果是有差异的,例如使用 su 命令的权限不同:将普通用户加入 wheel 组后,在该用户密码强度足够的前提下,该用户可以直接使用 su - 或 su - root 命令切换到 root 用户,而不必使用 sudo su - 或 sudo su - root 命令直接在 /etc/sudoers 文件中授予普通用户执行所有命令的权限后,该用户并不能直接使用 su - 或 su - root 命令切换到 root 用户,而必须要使用 sudo su - 或 sudo su - root 命令之所以出现这两种差异,是因为 /etc/pam.d/su 文件中有以下配置:auth required pam_wheel.so use_uid这一行配置的意思是:只允许只允许 root 用户和 wheel 群组的帐户使用 su 命令,限制其他帐户使用。openEuler 默认开启此配置,因此导致普通用户即使拥有执行所有命令的权限,也不能使用 su 命令2.3 案例三目标:授予普通用户执行任何命令的权限,但是禁止该用户切换到 root 用户在 /etc/sudoers 文件中添加以下内容:user1 ALL=(ALL) ALL, !/usr/bin/su - root, !/usr/bin/su - , !/usr/bin/bash配置说明:ALL :允许 user1 用户执行所有命令!/usr/bin/su - root :禁止 user1 用户执行 sudo su - root 命令切换到 root 用户!/usr/bin/su - :禁止 user1 用户执行 sudo su - 命令切换到 root 用户,因为 su - 命令后边为空则默认为 root 用户!/usr/bin/bash :禁止 user1 用户执行 sudo -i 、 sudo -i root 、 sudo /bin/bash 等方式切换到 root 用户效果演示:
-
xfs、ext4 文件系统都支持 LVM 逻辑卷缩容吗?如何对根分区缩容? 1 文件系统对缩容有无限制此节主要验证当前主流的 xfs 文件系统和 ext4 文件系统是否都支持 LVM 逻辑卷的缩容:验证按照目前众所周知的操作规范,缩容前先要卸载对应分区基于 openEuler 22.03 LTS SP1 操作系统进行验证(1)准备工作创建大小约为 25G 的卷组,后续基于此卷组创建逻辑卷# 创建大小约为 25G 的卷组(VG) $ vgcreate vg0 /dev/sdb Physical volume "/dev/sdb" successfully created. Volume group "vg0" successfully created # 查看创建的 VG 的详细信息 $ vgdisplay vg0 --- Volume group --- VG Name vg0 System ID Format lvm2 Metadata Areas 1 Metadata Sequence No 1 VG Access read/write VG Status resizable MAX LV 0 Cur LV 0 Open LV 0 Max PV 0 Cur PV 1 Act PV 1 VG Size <25.00 GiB PE Size 4.00 MiB Total PE 6399 Alloc PE / Size 0 / 0 Free PE / Size 6399 / <25.00 GiB VG UUID PhStrz-y8do-kZAl-a9hq-dkdj-mqZl-TTqDMX1.1 xfs 文件系统 LVM 逻辑卷缩容(1)创建大小约为 10G 的逻辑卷,并格式化为 xfs 文件系统,进行挂载测试# 创建大小为 10G 的逻辑卷 lv_xfs $ lvcreate -L +10G -n lv_xfs vg0 Logical volume "lv_xfs" created. # 查看创建的逻辑卷的详细信息 $ lvdisplay /dev/vg0/lv_xfs --- Logical volume --- LV Path /dev/vg0/lv_xfs LV Name lv_xfs VG Name vg0 LV UUID W5YEDp-9kx3-JChe-MxLJ-1P06-yfF3-KTtlzD LV Write Access read/write LV Creation host, time localhost.localdomain, 2024-03-13 09:20:51 +0800 LV Status available # open 0 LV Size 10.00 GiB Current LE 2560 Segments 1 Allocation inherit Read ahead sectors auto - currently set to 8192 Block device 253:3 # 将此逻辑卷格式化为 xfs 文件系统 $ mkfs.xfs /dev/vg0/lv_xfs meta-data=/dev/vg0/lv_xfs isize=512 agcount=4, agsize=655360 blks = sectsz=512 attr=2, projid32bit=1 = crc=1 finobt=1, sparse=1, rmapbt=0 = reflink=1 bigtime=1 inobtcount=1 data = bsize=4096 blocks=2621440, imaxpct=25 = sunit=0 swidth=0 blks naming =version 2 bsize=4096 ascii-ci=0, ftype=1 log =internal log bsize=4096 blocks=2560, version=2 = sectsz=512 sunit=0 blks, lazy-count=1 realtime =none extsz=4096 blocks=0, rtextents=0 # 挂载此逻辑卷,并查看挂载情况 $ mkdir /lv_xfs $ mount /dev/vg0/lv_xfs /lv_xfs/ $ df -Th /dev/vg0/lv_xfs Filesystem Type Size Used Avail Use% Mounted on /dev/mapper/vg0-lv_xfs xfs 10G 104M 9.9G 2% /lv_xfs(2)将以上逻辑卷缩容至 5G,查看分区是否正常# 卸载分区挂载 $ umount /dev/vg0/lv_xfs # 将逻辑卷缩容 5G $ lvreduce -L 5G /dev/vg0/lv_xfs WARNING: Reducing active logical volume to 5.00 GiB. THIS MAY DESTROY YOUR DATA (filesystem etc.) Do you really want to reduce vg0/lv_xfs? [y/n]: y Size of logical volume vg0/lv_xfs changed from 10.00 GiB (2560 extents) to 5.00 GiB (1280 extents). Logical volume vg0/lv_xfs successfully resized. # 重新格式化,出现报错 $ xfs_growfs /dev/vg0/lv_xfs xfs_growfs: /dev/vg0/lv_xfs is not a mounted XFS filesystem # 强制挂载,出现报错 $ mount /dev/vg0/lv_xfs /lv_xfs/ mount: /lv_xfs: can't read superblock on /dev/mapper/vg0-lv_xfs.出现报错,不能重新格式化,不能强制挂载,说明 xfs 文件系统的缩容存在问题如果使用 mkfs.xfs -f 命令进行强制格式化,则可以正常缩容,但是分区上的所有数据也会丢失,这种操作显然是不行的# 使用 mkfs.xfs -f 命令进行强制格式化 $ mkfs.xfs -f /dev/vg0/lv_xfs meta-data=/dev/vg0/lv_xfs isize=512 agcount=4, agsize=327680 blks = sectsz=512 attr=2, projid32bit=1 = crc=1 finobt=1, sparse=1, rmapbt=0 = reflink=1 bigtime=1 inobtcount=1 data = bsize=4096 blocks=1310720, imaxpct=25 = sunit=0 swidth=0 blks naming =version 2 bsize=4096 ascii-ci=0, ftype=1 log =internal log bsize=4096 blocks=2560, version=2 = sectsz=512 sunit=0 blks, lazy-count=1 realtime =none extsz=4096 blocks=0, rtextents=0 # 挂载,并查看分区大小 $ mount /dev/vg0/lv_xfs /lv_xfs/ $ df -Th /dev/vg0/lv_xfs Filesystem Type Size Used Avail Use% Mounted on /dev/mapper/vg0-lv_xfs xfs 5.0G 68M 5.0G 2% /lv_xfs(3)结论xfs 文件系统不能进行 LVM 逻辑卷的缩容操作1.2 ext4 文件系统 LVM 逻辑卷缩容(1)创建大小约为 10G 的逻辑卷,并格式化为 ext4 文件系统,进行挂载测试# 创建大小为 10G 的逻辑卷 lv_xfs $ lvcreate -L +10G -n lv_ext4 vg0 Logical volume "lv_ext4" created. # 查看创建的逻辑卷的详细信息 $ lvdisplay /dev/vg0/lv_ext4 --- Logical volume --- LV Path /dev/vg0/lv_ext4 LV Name lv_ext4 VG Name vg0 LV UUID 0yVn8J-OiP7-M0SB-GWZG-qHTa-YOC4-k8JVEK LV Write Access read/write LV Creation host, time localhost.localdomain, 2024-03-13 10:36:01 +0800 LV Status available # open 0 LV Size 10.00 GiB Current LE 2560 Segments 1 Allocation inherit Read ahead sectors auto - currently set to 8192 Block device 253:4 # 将此逻辑卷格式化为 xfs 文件系统 $ mkfs.ext4 /dev/vg0/lv_ext4 mke2fs 1.46.4 (18-Aug-2021) Creating filesystem with 2621440 4k blocks and 655360 inodes Filesystem UUID: 3794e4d4-4cbf-4aaa-921c-1e7159edef07 Superblock backups stored on blocks: 32768, 98304, 163840, 229376, 294912, 819200, 884736, 1605632 Allocating group tables: done Writing inode tables: done Creating journal (16384 blocks): done Writing superblocks and filesystem accounting information: done # 挂载此逻辑卷,并查看挂载情况 $ mkdir /lv_ext4 $ mount /dev/vg0/lv_ext4 /lv_ext4/ $ df -Th /dev/vg0/lv_ext4 Filesystem Type Size Used Avail Use% Mounted on /dev/mapper/vg0-lv_ext4 ext4 9.8G 24K 9.3G 1% /lv_ext4(2)将以上逻辑卷缩容至 5G,查看分区是否正常# 卸载分区挂载 $ umount /dev/vg0/lv_ext4 # 进行磁盘检查(必须步骤) $ e2fsck -f /dev/vg0/lv_ext4 e2fsck 1.46.4 (18-Aug-2021) Pass 1: Checking inodes, blocks, and sizes Pass 2: Checking directory structure Pass 3: Checking directory connectivity Pass 4: Checking reference counts Pass 5: Checking group summary information /dev/vg0/lv_ext4: 11/655360 files (0.0% non-contiguous), 66753/2621440 blocks # 缩容文件系统 $ resize2fs /dev/vg0/lv_ext4 5G resize2fs 1.46.4 (18-Aug-2021) Resizing the filesystem on /dev/vg0/lv_ext4 to 1310720 (4k) blocks. The filesystem on /dev/vg0/lv_ext4 is now 1310720 (4k) blocks long. # 回收逻辑卷空闲空间 $ lvreduce -L 5G /dev/vg0/lv_ext4 WARNING: Reducing active logical volume to 5.00 GiB. THIS MAY DESTROY YOUR DATA (filesystem etc.) Do you really want to reduce vg0/lv_ext4? [y/n]: y Size of logical volume vg0/lv_ext4 changed from 10.00 GiB (2560 extents) to 5.00 GiB (1280 extents). Logical volume vg0/lv_ext4 successfully resized. # 重新挂载,并查看挂载情况 $ mount /dev/vg0/lv_ext4 /lv_ext4/ $ df -Th /dev/vg0/lv_ext4 Filesystem Type Size Used Avail Use% Mounted on /dev/mapper/vg0-lv_ext4 ext4 4.9G 24K 4.6G 1% /lv_ext4(3)结论ext4 文件系统可以进行 LVM 逻辑卷的缩容操作1.3 结论经过以上测试,得出结论:xfs 文件系统不能进行 LVM 逻辑卷的缩容操作,ext4 文件系统可以进行 LVM 逻辑卷的缩容操作另外,也可以通过另外一种缩容方式明确得出这一结论。即使用 lvreduce 命令的 -r 参数,此参数表示在缩容时同时使用 fsadm 调整底层文件系统的大小:$ man lvreduce ...... -r|--resizefs Resize underlying filesystem together with the LV using fsadm(8). ......(1)xfs 文件系统 LVM 逻辑卷缩容# 执行以下命令对 xfs 文件系统的 LVM 逻辑卷缩容 $ lvreduce -r -L 5G /dev/vg0/lv_xfs输出内容如下图所示:报错显示:Xfs filesystem shrinking is unsuppored(Xfs 文件系统收缩不被支持)(2)ext4 文件系统 LVM 逻辑卷缩容# 执行以下命令对 ext4 文件系统的 LVM 逻辑卷缩容 $ lvreduce -r -L 5G /dev/vg0/lv_ext4输出内容如下图所示: 信息显示逻辑卷缩容成功2 能否挂载状态缩容现有处于挂载状态的文件系统为 ext4 的逻辑卷:直接对其进行缩容操作,命令执行过程中会询问是否卸载分区:缩容后,会自动挂载分区:综上,不能对处于挂载状态的逻辑卷分区进行缩容操作,工具会自动卸载、挂载3 如何对根分区进行缩容由 2.2 得出结论,在对逻辑卷缩容时必须要先卸载分区。正常系统中,根分区显然是不能卸载的,那么想对根分区进行缩容该如何操作呢?进单用户模式进行操作,发现单用户模式并没有 lvm 相关命令正确的根分区缩容操作如下:(1)使用光盘进入救援模式,选择 “ 3) Skip to shell ”,这样可以不去挂载 /mnt/sysroot 或 /mnt/sysimage(2)执行 lsblk 命令查看逻辑卷是否处于激活状态,即是否有 /dev/mapper/... 相关路径,若没有则需要先激活逻辑卷(3)执行 vgchange -ay 命令激活所有卷组及其逻辑卷,之后再次执行 lsblk 命令查看逻辑卷路径(4)执行 lvreduce -r -L -20G /dev/mapper/openeuler-root 命令进行缩容操作,并验证缩容结果(5)退出救援模式,进入系统,验证缩容结果及系统有无异常至此,根分区成功缩容!
-
基于 openEuler 操作系统使用 Sealos 构建 Kubernetes 高可用集群 {card-default label="前情提要" width="100%"}本文篇幅较长,您可以耐心阅读,也可以从右侧目录中选择需要查看的部分{/card-default}1 前言(1)本文主要包含以下几个方面的内容:使用 Sealos 工具构建 Kubernetes 高可用集群(3 master,1 node)使用 Helm 安装 Ingress-nginx,并使用 Service 的 NodePort 模式向集群外部暴露端口部署 Prometheus 监控工具和 Grafana 图形化展示工具,使用 Ingress-nginx 作入口访问代理部署过程常见的错误及解决方案(2)本文使用机器详情主机名称身份IP 地址操作系统版本Linux 内核版本m0master192.168.255.100openEuler 22.03 (LTS-SP2)5.10.0-153.12.0.92.oe2203sp2.x86_64m1master192.168.255.101openEuler 22.03 (LTS-SP2)5.10.0-153.12.0.92.oe2203sp2.x86_64m2master192.168.255.102openEuler 22.03 (LTS-SP2)5.10.0-153.12.0.92.oe2203sp2.x86_64n1node192.168.255.103openEuler 22.03 (LTS-SP2)5.10.0-153.12.0.92.oe2203sp2.x86_64(3)组件版本及安装方式Kubernetes、Helm、Calico 均使用当前最新版本组件名称版本号安装方式软件来源Kubernetes1.28.3Sealos + 镜像labring/kubernetes - Docker ImageHelm3.12.3Sealos + 镜像labring/helm - Docker ImageCalico3.26.1Sealos + 镜像labring/calico - Docker ImageIngress-nginx4.8.3Helm + Chart 包ingress-nginx 4.8.3 · kubernetes/ingress-nginx (artifacthub.io)Prometheus + Grafana0.13kubectlGitHub - prometheus-operator/kube-prometheus at release-0.13(4)注意事项请确保机器可以访问谷歌镜像仓库、红帽镜像仓库及 Github,需要下载镜像及源代码主机之间最好能够相互免密登录主机之间保持时间同步主机名称唯一,不能相同不要自己装 Docker2 Kubernetes 集群构建2.1 下载 sealos 工具注意:此步骤需要在所有节点运行# 获取 sealos 工具的所有可用版本号 [root@m0 ~]# curl --silent "https://api.github.com/repos/labring/sealos/releases" | jq -r '.[].tag_name' v5.0.0-alpha2 v4.3.7-rc1 v4.3.6 v4.4.0-beta2 v4.4.0-beta1 v4.3.5 v4.3.4 v4.4.0-alpha3 v4.4.0-alpha1 v4.3.3 v4.3.2 ...... # 设置 VERSION 环境变量,此处我设置为 v4.3.6,即安装 4.3.6 版本 [root@m0 ~]# VERSION=v4.3.6 && echo $VERSION v4.3.6 # 下载 sealos 工具 [root@m0 ~]# wget https://github.com/labring/sealos/releases/download/${VERSION}/sealos_${VERSION#v}_linux_amd64.tar.gz 正在保存至: “sealos_4.3.6_linux_amd64.tar.gz” sealos_4.3.6_linux_amd64.tar.gz 100%[===================================>] 60.05M 9.58MB/s 用时 7.8s 2023-10-30 15:24:15 (7.69 MB/s) - 已保存 “sealos_4.3.6_linux_amd64.tar.gz” [62963874/62963874]) # 解压 sealos 工具,加可执行权限,并将其移动到 /usr/local/bin/ 目录下 [root@m0 ~]# tar -zxvf sealos_4.3.6_linux_amd64.tar.gz sealos && chmod +x sealos && mv sealos /usr/local/bin # 查看 sealos 工具是否安装成功 [root@m0 ~]# sealos version SealosVersion: buildDate: "2023-10-20T14:15:00Z" compiler: gc gitCommit: a2719848 gitVersion: 4.3.6 goVersion: go1.20.10 platform: linux/amd642.2 sealos 相关命令(1)sealos run 构建集群# 构建 Kubernetes 高可用集群 $ sealos run IMAGE --masters IP1,IP2,IP3... --nodes IP1,IP2,IP3... -p SSH-PASSWORD 参数说明: IMAGE:需要安装的 Kubernetes 及组件的镜像 --masters:指定 Kubernetes master 节点的 IP 地址 --nodes:指定 Kubernetes node 节点的 IP 地址 -p SSH-PASSWORD:指定 SSH 远程登录的密码 例程: $ sealos run labring/kubernetes:v1.25.0 labring/helm:v3.8.2 labring/calico:v3.24.1 \ --masters 192.168.64.2,192.168.64.22,192.168.64.20 \ --nodes 192.168.64.21,192.168.64.19 \ -p 123456(2)sealos run 安装应用# 安装各种应用 $ sealos run IMAGE 参数说明: IMAGE:要安装的应用的镜像 例程: $ sealos run labring/helm:v3.8.2(3) sealos add 增加节点# 增加 master 节点 $ sealos add --masters 192.168.1.1,192.168.1.2 # 增加 node 节点 $ sealos add --nodes 192.168.1.3,192.168.1.4(4) sealos delete 删除节点# 删除 master 节点 $ sealos delete --masters 192.168.1.1,192.168.1.2 # 删除 node 节点 $ sealos delete --nodes 192.168.1.3,192.168.1.4(5)sealos reset 清理集群# 清理 Kubernetes 集群 $ sealos reset(6)sealos status 查看集群# 查看 Kubernetes 集群运行状态 $ sealos status(7)其他命令# 同 docker 命令的用法,不再赘述 $ sealos pull $ sealos images $ sealos rmi $ sealos ps2.3 使用 sealos 构建集群再次申明安装注意事项(参考官方说明):每个集群节点应该有不同的主机名。 主机名不要带下划线所有节点的时间同步在 Kubernetes 集群的第一个节点上运行sealos run命令,目前集群外的节点不支持集群安装建议使用干净的操作系统来创建集群。不要自己装 Docker支持大多数 Linux 发行版,例如:Ubuntu CentOS Rocky linux支持 DockerHub 中支持的 Kubernetes 版本支持使用 containerd 作为容器运行时在公有云上请使用私有 IP注意:此步骤只在第一个 master 节点上执行(1)执行以下命令构建集群[root@m0 ~]# sealos run labring/kubernetes:v1.28.3 labring/helm:v3.12.3 labring/calico:v3.26.1 \ --masters 192.168.255.100,192.168.255.101,192.168.255.102 \ --nodes 192.168.255.103 \ -p 123456(2)执行上述命令后,不需要额外操作,一直等待出现以下界面,表示构建完成2023-10-30T15:49:36 info succeeded in creating a new cluster, enjoy it! 2023-10-30T15:49:36 info ___ ___ ___ ___ ___ ___ /\ \ /\ \ /\ \ /\__\ /\ \ /\ \ /::\ \ /::\ \ /::\ \ /:/ / /::\ \ /::\ \ /:/\ \ \ /:/\:\ \ /:/\:\ \ /:/ / /:/\:\ \ /:/\ \ \ _\:\~\ \ \ /::\~\:\ \ /::\~\:\ \ /:/ / /:/ \:\ \ _\:\~\ \ \ /\ \:\ \ \__\ /:/\:\ \:\__\ /:/\:\ \:\__\ /:/__/ /:/__/ \:\__\ /\ \:\ \ \__\ \:\ \:\ \/__/ \:\~\:\ \/__/ \/__\:\/:/ / \:\ \ \:\ \ /:/ / \:\ \:\ \/__/ \:\ \:\__\ \:\ \:\__\ \::/ / \:\ \ \:\ /:/ / \:\ \:\__\ \:\/:/ / \:\ \/__/ /:/ / \:\ \ \:\/:/ / \:\/:/ / \::/ / \:\__\ /:/ / \:\__\ \::/ / \::/ / \/__/ \/__/ \/__/ \/__/ \/__/ \/__/ Website: https://www.sealos.io/ Address: github.com/labring/sealos Version: 4.3.6-a2719848(3)查看 Kubernetes 集群运行状态[root@m0 ~]# sealos status ...... Systemd Service Status Logger: journalctl -xeu SERVICE-NAME Error: <nil> Init System List: Name: kubelet Status: Enable && Active Name: containerd Status: Enable && Active Name: cri-docker Status: Disable && NotActive Name: docker Status: Disable && NotActive Name: registry Status: Enable && Active Name: image-cri-shim Status: Enable && Active Cluster Node Status ReadyNode: 4/4 Cluster Pod Status Namespace: calico-apiserver RunningPod: 2/2 Namespace: calico-system RunningPod: 11/11 Namespace: default RunningPod: 0/0 Namespace: kube-node-lease RunningPod: 0/0 Namespace: kube-public RunningPod: 0/0 Namespace: kube-system RunningPod: 19/19 Namespace: tigera-operator RunningPod: 1/1 Cluster Service Status Namespace: calico-apiserver HealthService: 1/1 UnhealthServiceList: Namespace: calico-system HealthService: 2/2 UnhealthServiceList: Namespace: default HealthService: 1/1 UnhealthServiceList: Namespace: kube-node-lease HealthService: 0/0 UnhealthServiceList: Namespace: kube-public HealthService: 0/0 UnhealthServiceList: Namespace: kube-system HealthService: 1/1 UnhealthServiceList: Namespace: tigera-operator HealthService: 0/0 UnhealthServiceList: Error: failed to run checker: pods "kube-apiserver-n1" not found(4)查看主要组件 Pod 运行情况[root@m0 ~]# kubectl get pod -A NAMESPACE NAME READY STATUS RESTARTS AGE calico-apiserver calico-apiserver-5c7799c9d7-bclsw 1/1 Running 0 6m31s calico-apiserver calico-apiserver-5c7799c9d7-fkqjx 1/1 Running 0 6m31s calico-system calico-kube-controllers-65f68c6768-8vhnp 1/1 Running 0 7m5s calico-system calico-node-6dgtc 1/1 Running 0 7m5s calico-system calico-node-clbn7 1/1 Running 0 7m5s calico-system calico-node-gf8kh 1/1 Running 0 7m5s calico-system calico-node-lqzlb 1/1 Running 0 7m5s calico-system calico-typha-b98b4d5f8-dx649 1/1 Running 0 6m57s calico-system calico-typha-b98b4d5f8-hlclk 1/1 Running 0 7m5s calico-system csi-node-driver-29z2d 2/2 Running 0 7m5s calico-system csi-node-driver-c7wrb 2/2 Running 0 7m5s calico-system csi-node-driver-f79sh 2/2 Running 0 7m5s calico-system csi-node-driver-rlrw4 2/2 Running 0 7m5s kube-system coredns-5dd5756b68-7r7mw 1/1 Running 0 11m kube-system coredns-5dd5756b68-x2g2x 1/1 Running 0 11m kube-system etcd-m0 1/1 Running 0 11m kube-system etcd-m1 1/1 Running 0 9m13s kube-system etcd-m2 1/1 Running 0 7m27s kube-system kube-apiserver-m0 1/1 Running 0 11m kube-system kube-apiserver-m1 1/1 Running 0 9m9s kube-system kube-apiserver-m2 1/1 Running 0 7m17s kube-system kube-controller-manager-m0 1/1 Running 0 11m kube-system kube-controller-manager-m1 1/1 Running 0 9m6s kube-system kube-controller-manager-m2 1/1 Running 0 7m27s kube-system kube-proxy-9nsl5 1/1 Running 0 9m18s kube-system kube-proxy-hdlbn 1/1 Running 0 7m14s kube-system kube-proxy-ptq8n 1/1 Running 0 11m kube-system kube-proxy-xhphx 1/1 Running 0 7m28s kube-system kube-scheduler-m0 1/1 Running 0 11m kube-system kube-scheduler-m1 1/1 Running 0 9m12s kube-system kube-scheduler-m2 1/1 Running 0 7m23s kube-system kube-sealos-lvscare-n1 1/1 Running 0 6m57s tigera-operator tigera-operator-94d7f7696-zwzh5 1/1 Running 0 7m10s所有 Pod 均为 Running 状态,至此 Kubernetes 集群构建完成3 安装 Ingress-nginx(1)添加 Helm 仓库[root@m0 ~]# helm repo add ingress-nginx https://kubernetes.github.io/ingress-nginx "ingress-nginx" has been added to your repositories(2)下载 Ingress-nginx 的 chart 包,并解压[root@m0 ~]# helm fetch ingress-nginx/ingress-nginx --version 4.8.3 [root@m0 ~]# ls ingress-nginx-4.8.3.tgz [root@m0 ~]# tar -zxvf ingress-nginx-4.8.3.tgz(3)修改 values.yaml 文件因为默认的暴露方式为 LoadBalancer,需要对接云平台,因此需要将 values.yaml 中的 LoadBalance 更改为 NodePort,并进行暴露端口的配置[root@m0 ~]# cd ingress-nginx [root@m0 ingress-nginx]# vim values.yaml type: NodePort ## type: NodePort ## nodePorts: ## http: 32080 ## https: 32443 ## tcp: ## 8080: 32808 nodePorts: http: "32080" https: "32443"(4)部署 Ingress-nginx# 创建 ingress-nginx 名字空间 [root@m0 ingress-nginx]# kubectl create namespace ingress-nginx namespace/ingress-nginx created # 安装 ingress-nginx,注意命令末尾的 . 不能省略,表示当前目录 [root@m0 ingress-nginx]# helm install -n ingress-nginx ingress-nginx -f values.yaml .(5)等待出现以下提示,表示安装完成,还需进一步确认 pod 运行状态NAME: ingress-nginx LAST DEPLOYED: Mon Oct 30 18:08:16 2023 NAMESPACE: ingress-nginx STATUS: deployed REVISION: 1 TEST SUITE: None NOTES: The ingress-nginx controller has been installed. Get the application URL by running these commands: export HTTP_NODE_PORT=32080 export HTTPS_NODE_PORT=32443 export NODE_IP=$(kubectl --namespace ingress-nginx get nodes -o jsonpath="{.items[0].status.addresses[1].address}") echo "Visit http://$NODE_IP:$HTTP_NODE_PORT to access your application via HTTP." echo "Visit https://$NODE_IP:$HTTPS_NODE_PORT to access your application via HTTPS." An example Ingress that makes use of the controller: apiVersion: networking.k8s.io/v1 kind: Ingress metadata: name: example namespace: foo spec: ingressClassName: nginx rules: - host: www.example.com http: paths: - pathType: Prefix backend: service: name: exampleService port: number: 80 path: / # This section is only required if TLS is to be enabled for the Ingress tls: - hosts: - www.example.com secretName: example-tls If TLS is enabled for the Ingress, a Secret containing the certificate and key must also be provided: apiVersion: v1 kind: Secret metadata: name: example-tls namespace: foo data: tls.crt: <base64 encoded cert> tls.key: <base64 encoded key> type: kubernetes.io/tls(6)确认 pod 的运行状态[root@m0 ingress-nginx]# kubectl get pod -n ingress-nginx NAME READY STATUS RESTARTS AGE ingress-nginx-controller-798796947c-tbp2m 1/1 Running 0 6m18sPod 的状态为 Running 表示安装全部成功(7)查看暴露的端口[root@m0 ingress-nginx]# kubectl get svc -n ingress-nginx NAME TYPE CLUSTER-IP EXTERNAL-IP PORT(S) AGE ingress-nginx-controller NodePort 10.96.0.134 <none> 80:32080/TCP,443:32443/TCP 9m46s ingress-nginx-controller-admission ClusterIP 10.96.2.66 <none> 443/TCP 9m46s已对集群外暴露 32080 和 32443 端口,分别作为 HTTP 和 HTTPS 的端口号(8)访问测试在 Windows 浏览器中输入 http://Node_IP:32080,例如 http://192.168.255.100:32080 进行访问测试出现此界面表示安装配置成功,即能够开始使用 Ingress-nginx 了说明:在访问测试中,之所以出现 404 报错,是因为没有指定后端 Service,而是使用了默认后端,此为正常现象4 安装 Prometheus4.1 安装 Prometheus(1)从 Github 克隆源代码[root@m0 ~]# git clone https://github.com/prometheus-operator/kube-prometheus.git 正克隆到 'kube-prometheus'... remote: Enumerating objects: 18736, done. remote: Counting objects: 100% (5373/5373), done. remote: Compressing objects: 100% (332/332), done. remote: Total 18736 (delta 5194), reused 5060 (delta 5036), pack-reused 13363 接收对象中: 100% (18736/18736), 9.72 MiB | 4.60 MiB/s, 完成. 处理 delta 中: 100% (12619/12619), 完成. [root@m0 ~]# ls kube-prometheus(2)创建名字空间和 CDRs# 进入项目目录 [root@m0 ~]# cd kube-prometheus/ # 创建 monitoring 名字空间 [root@m0 kube-prometheus]# kubectl apply --server-side -f manifests/setup ...... namespace/monitoring serverside-applied # 创建 CRDs(Custom Resource Definition,自定义资源) [root@m0 kube-prometheus]# kubectl wait \ --for condition=Established \ --all CustomResourceDefinition \ --namespace=monitoring # 查看是否生效 [root@m0 kube-prometheus]# kubectl get namespace NAME STATUS AGE monitoring Active 109s(3)安装 prometheus[root@m0 kube-prometheus]# kubectl apply -f manifests/注意:Pod 之间存在互相调用关系,但是 Pod 创建有快慢,导致调用出现问题,因此需要根据命令返回的结果,可能需要多次执行该命令,直至所有返回结果均为 created 状态(4)查看 Pod 运行状态[root@m0 ~]# kubectl get pod -n monitoring NAME READY STATUS RESTARTS AGE alertmanager-main-0 2/2 Running 0 3m1s alertmanager-main-1 2/2 Running 0 3m1s alertmanager-main-2 2/2 Running 0 3m1s blackbox-exporter-76b5c44577-crv2h 3/3 Running 0 5m5s grafana-748964b847-8d5c2 1/1 Running 0 5m3s kube-state-metrics-6c664d5dc8-xsqkm 3/3 Running 0 5m3s node-exporter-gxqct 2/2 Running 0 5m2s node-exporter-hf26f 2/2 Running 0 5m2s node-exporter-jvrk9 2/2 Running 0 5m2s node-exporter-qb8w7 2/2 Running 0 5m2s prometheus-adapter-7cc789bfcc-64wp8 1/1 Running 0 5m1s prometheus-adapter-7cc789bfcc-mr9zm 1/1 Running 0 5m1s prometheus-k8s-0 2/2 Running 0 3m prometheus-k8s-1 2/2 Running 0 3m prometheus-operator-6479b5dff9-6w9ft 2/2 Running 0 5m1s等待所有 Pod 全部为 Running 状态,则安装完成(5)查看相关的 Service[root@m0 ~]# kubectl get svc -n monitoring NAME TYPE CLUSTER-IP EXTERNAL-IP PORT(S) AGE alertmanager-main ClusterIP 10.96.3.53 <none> 9093/TCP,8080/TCP 3m37s alertmanager-operated ClusterIP None <none> 9093/TCP,9094/TCP,9094/UDP 93s blackbox-exporter ClusterIP 10.96.1.22 <none> 9115/TCP,19115/TCP 3m37s grafana ClusterIP 10.96.0.151 <none> 3000/TCP 3m35s kube-state-metrics ClusterIP None <none> 8443/TCP,9443/TCP 3m35s node-exporter ClusterIP None <none> 9100/TCP 3m34s prometheus-adapter ClusterIP 10.96.2.118 <none> 443/TCP 3m33s prometheus-k8s ClusterIP 10.96.2.71 <none> 9090/TCP,8080/TCP 3m34s prometheus-operated ClusterIP None <none> 9090/TCP 92s prometheus-operator ClusterIP None <none> 8443/TCP 3m33s这里我们重点关注 grafana 和 prometheus-k8s 的 Service 名称和端口号,要在 ingress-nginx 中使用4.2 使用 Ingress 反向代理经过 4.1 的一顿操作,Prometheus 已经可以被正常访问了。然而,由于使用的 Service 的 ClusterIP 模式,因此只能在集群内部访问要想实现在集群外部访问,要么将 ClusterIP 模式更改为 NodePort 模式暴露端口,要么使用 Ingress 作反向代理访问,既然已经安装了 Ingress-nginx,那就用 Ingress 吧(1)创建名称为 prometheus-ingress.yaml 的资源清单[root@m0 ~]# vim prometheus-nginx.yaml apiVersion: networking.k8s.io/v1 kind: Ingress metadata: namespace: monitoring # 指定名字空间,需要和 Prometheus 所在的名字空间一致 name: prometheus # 随便起一个好记的名字吧 spec: ingressClassName: nginx # 重点,必须指定 ingress-ningx 类,使用此命令查询 kubectl get ingressclass rules: - host: grafana.k8s.xyz # 定义一个域名,访问此域名则访问 grafana http: paths: - path: / # 匹配所有路径 pathType: Prefix # 匹配规则为前缀匹配 backend: # 指定要代理的后端 service: # 后端为 Service name: grafana # 要访问的 Service 名称,必须和 kubectl get svc 查询到的一致 port: number: 3000 # 后端 Service 的端口号,必须和 kubectl get svc 查询到的一致 - host: prometheus.k8s.xyz http: paths: - path: / pathType: Prefix backend: service: name: prometheus-k8s port: number: 9090(2)将资源清单实例化[root@m0 ~]# kubectl apply -f prometheus-nginx.yaml ingress.networking.k8s.io/prometheus created(3)查看创建的 Ingress 对象[root@m0 ~]# kubectl get ingress -n monitoring NAME CLASS HOSTS ADDRESS PORTS AGE prometheus nginx grafana.k8s.xyz,prometheus.k8s.xyz 10.96.0.134 80 38s(4)查看反向代理规则[root@m0 ~]# kubectl get ingress -n monitoring prometheus ...... Rules: Host Path Backends ---- ---- -------- grafana.k8s.xyz / grafana:3000 (100.75.187.137:3000) prometheus.k8s.xyz / prometheus-k8s:9090 (100.94.130.69:9090,100.94.139.202:9090) ......若此处的后端(Backends)出现了 error 字样,则表示代理失败,原因及解决方案可查看第 5.2 节(5)访问测试注意:提前在 C:\Windows\System32\drivers\etc\hosts 配置好 DNS 解析规则关闭 Kubernetes 所有节点的防火墙并清空防火墙规则在 Windows 浏览器中输入 http://grafana.k8s.xyz:32080,即可进入 Grafana 界面在 Windows 浏览器中输入 http://prometheus.k8s.xyz:32080,即可进入 Grafana 界面4.3 配置路由器端口映射虽然在集群外使用 Windows 浏览器访问到 Prometheus 和 Grafana 了,但是每次输入域名还要输入端口号,这件事情一点都不优雅。另外,假如端口号忘记了,emm...,反正非常麻烦。要解决这一问题也很简单:将 NodePort 暴露的 Ingress 端口更改为 80 和 443 就好了。然而因为 Kubernetes 给 NodePort 分配默认端口号范围为 30000~32767 ,并且是不允许手动更改范围之外的端口号的,强行更改则需要先更改 Kubernetes 规则,此处不再详述,感兴趣的可以搜索教程另外也实在没必要折腾,因为折腾之后你会发现虽然能够在 Kubernetes 集群外访问,但还没有跳出局域网这个禁锢。即生产环境中不可能让我们直接访问后端服务器,都需要通过入口的路由器的公网网口,路由器端口映射(DNAT)完美解决了这个问题,这样就能实现真正的公网访问了(当然也可以使用外部方向代理)以下是具体操作流程:我使用的是 openWrt 软路由,wan 的 IP 地址为 192.168.230.230,lan 的 IP 地址为192.168.255.2,端口映射策略为:这个策略相当于以下防火墙规则:iptables -t nat -A PREROUTING -i eth0 -d 192.168.230.230 -p tcp --dport 80 -j DNAT --to-destination 192.168.255.101:32080此规则的具体含义为:任意来源 IP 只要访问公网网口的 80 端口,则将目标地址转换为内网 Kubernetes 集群的任意一台主机地址的 32080 端口也许你还有一个疑问,真实生产环境中,路由器的公网 IP 地址可能是动态 IP,经常发生变化,那我也不能总盯着 IP 地址来更新防火墙策略吧。解决这一个问题同样也很简单,只需将域名进行 DDNS(动态域名解析)配置,即可将域名精准解析到公网网口 IP,无论 IP 地址怎样变化此时,我们只需要访问 http://grafana.k8s.xyz 和 http://prometheus.k8s.xyz 即可访问 Grafana 和 Prometheus 了,终于不用输入那烦人的端口号了,是不是很优雅 😄注意:本文演示中,使用用 DNAT 策略将目标地址修改为集群某一个节点的 IP 地址和端口,这样做的缺点是若目标节点死亡,则访问会失败。实际上可以使用 Nginx 或 LVS 将流量负载到集群的多个节点上(因为 NodePort 模式会在集群所有节点上都绑定暴露的端口),既能防止单点故障又能降低单节点访问压力5 常见报错及处理方案5.1 访问失败或 502、504故障现象:使用浏览器访问集群内部服务时,访问失败,但并没有返回错误代码,如下图所示故障关键字:无法访问此网站排查思路:① 首先查看域名输入是否正确,是否是 Ingress 资源清单中 host 字段匹配的域名② 查看 DNS 是否正确配置,并且能否解析到正确的 IP 地址③ 不妨清理一下 Kubernetes 集群所有节点的防火墙规则吧疑问:在实验过程中发现,系统防火墙总是被创建了大量和 Calico 相关的自定义规则链和对应的规则,这些规则会阻挡集群外部的访问。当执行 iptables -F 命令清空防火墙规则后,并没有发现集群运行出现异常。等待一段时间后这些规则又会被创建,非常烦人,因此我直接使用了一个循环,每隔 5 秒清理一次防火墙规则5.2 Ingress 代理失败故障现象:在执行 kubectl describe ingress INGRESS_NAME 命令查看代理规则时,发现代理的后端 Service 出现 error,如图所示故障关键字:<error: endopints " " not fond>故障原因:虽然指定了后端 Service 和端口,但是指定的 Service 不能关联到提供服务的 Pod,这是因为 Ingress 对象所在的名字空间和提供服务的 Pod 及 Service 所在的名字空间不一致,出现了隔离 解决方案:在 Ingress 资源清单文件中指定和要关联的Service 和 Pod 相同的名字空间即可# 指定 .spec.metadata.namespace 字段 apiVersion: networking.k8s.io/v1 kind: Ingress metadata: namespace: monitoring name: test spec: ingressClassName: nginx rules: - host: grafana.k8s.xyz.test http: paths: - path: / pathType: Prefix backend: service: name: grafana port: number: 3000 - host: prometheus.k8s.xyz.test http: paths: - path: / pathType: Prefix backend: service: name: prometheus-k8s port: number: 9090[root@m0 ~]# kubectl apply -f test.yaml ingress.networking.k8s.io/test created [root@m0 ~]# kubectl describe ingress -n monitoring test ...... Rules: Host Path Backends ---- ---- -------- grafana.k8s.xyz.test / grafana:3000 (100.75.187.149:3000) prometheus.k8s.xyz.test / prometheus-k8s:9090 (100.94.130.72:9090,100.94.139.204:9090) ......Ingress 反向代理正常,没有出现 error 字样5.3 Ingress 代理 404 报错故障现象:在配置好 Ingress 并确认代理的各项设置没问题后,访问时竟然出现 404 Not Found 报错排错思路:① 出现此报错说明已经能够访问 Ingress-nginx 了,先排除网络、防火墙方面的问题② 404 Not Found 错误代码含义为:请求资源无法被找到③ 既然确认了代理没问题,各项设置没有问题,那不妨查看 Ingress-nginx-controller 的日志怎么说吧为什么要查看 Ingress-nginx-controller 这个 Pod 的日志呢?Ingress-nginx 本身是一个 nginx 服务器。在安装 Ingress-nginx 控制器时,会部署一个名称为 Ingress-nginx-controller-xxxxx 的 Pod,里面运行了一个被魔改的 nginx当我们创建 Ingress 对象时,会把代理规则写入到这个 Pod 中的 nginx 配置文件中,此即 Ingress 对象和 Ingress-nginx 控制器的关系,查看这个 Pod 的日志即能够查看真实的访问流程及事件[root@m0 prometheus]# kubectl logs -n ingress-nginx ingress-nginx-controller-798796947c-tbp2m ...... W1031 06:06:44.699584 6 controller.go:331] ignoring ingress prometheus in monitoring based on annotation : ingress does not contain a valid IngressClass ......从日志中看到这样一段日志信息,其意为我们创建的 Ingress 对象没有包含可用的 IngressClass。那么问题来了,什么是 IngressClass?又该如何配置 IngressClass 呢?(1)什么是 IngressClass在安装 Ingress 控制器时,我们可能部署了多个不同类型的 Ingress Controller,或者部署了多个同一类型的 Ingress Controller(如部署多个 Ingress-nginx),为了区分不同的 Ingress Controller,会为每个 Ingress Controller 设定唯一的 Class,防止出错(2)如何配置 IngressClass① 首先执行如下命令,查看 IngressClassName[root@m0 ~]# kubectl get ingressclass NAME CONTROLLER PARAMETERS AGE nginx k8s.io/ingress-nginx <none> 20h② 在资源清单中添加 IngressClassName 字段# 在 .spec.ingressClassName 字段中指定 apiVersion: networking.k8s.io/v1 kind: Ingress metadata: namespace: monitoring name: prometheus spec: ingressClassName: nginx rules: - host: grafana.k8s.xyz http: paths: - path: / pathType: Prefix backend: service: name: grafana port: number: 3000 - host: prometheus.k8s.xyz http: paths: - path: / pathType: Prefix backend: service: name: prometheus-k8s port: number: 9090问题完美解决,访问一切正常